


 Documentation
Sentinel Dashboard
1. Introduction
Sentinel provides a simple stand-alone dashboard, on which you can monitor your applications, and configure the rules in real time. It includes the following features:
- Machine discovery
- Resource monitoring for single machine or clusters with less than 500 nodes
- Rule management
2. Start the dashboard
2.1 Download the dashboard
You can download the latest Sentinel Dashboard jar from the release page.
You can also build from code:
- Download Dashboard module (
dashboard/enbranch to build English version); - Package it to fat jar with the following command:
mvn clean package;
2.2 Run the dashboard
Use the following command to start the dashboard:
java -Dserver.port=8080 -Dcsp.sentinel.dashboard.server=localhost:8080 -Dproject.name=sentinel-dashboard -jar sentinel-dashboard.jar
-Dserver.port=8080is the HTTP port of the Sentinel Dashboard.
3. Applications
Perform the following 2 steps to connect your application to the dashboard.
3.1 Download JAR
If your project is a Maven project, add the following dependency in your pom.xml. Otherwise, please download it from Maven.
<dependency>
    <groupId>com.alibaba.csp</groupId>
    <artifactId>sentinel-transport-simple-http</artifactId>
    <version>x.y.z</version>
</dependency>
3.2 Configure dashboard IP address
Add dashboard IP address when starting the application: -Dcsp.sentinel.dashboard.server=consoleIp:port.
In addition to JVM parameters, you can also do this by configuring property files. For more details, see Configuration.
4. Invocation Resource
After the above steps are completed, if any resource is called, your application will start to send its heartbeat to the dashboard. You can check the following information on the dashboard:
a. "Machine Discovery" will display machines grouped by their application names
Machine List page:

b. "Resources Tracing" will display resources by machine
Note: Resources displayed in "Resource Chain" are stored in memory.

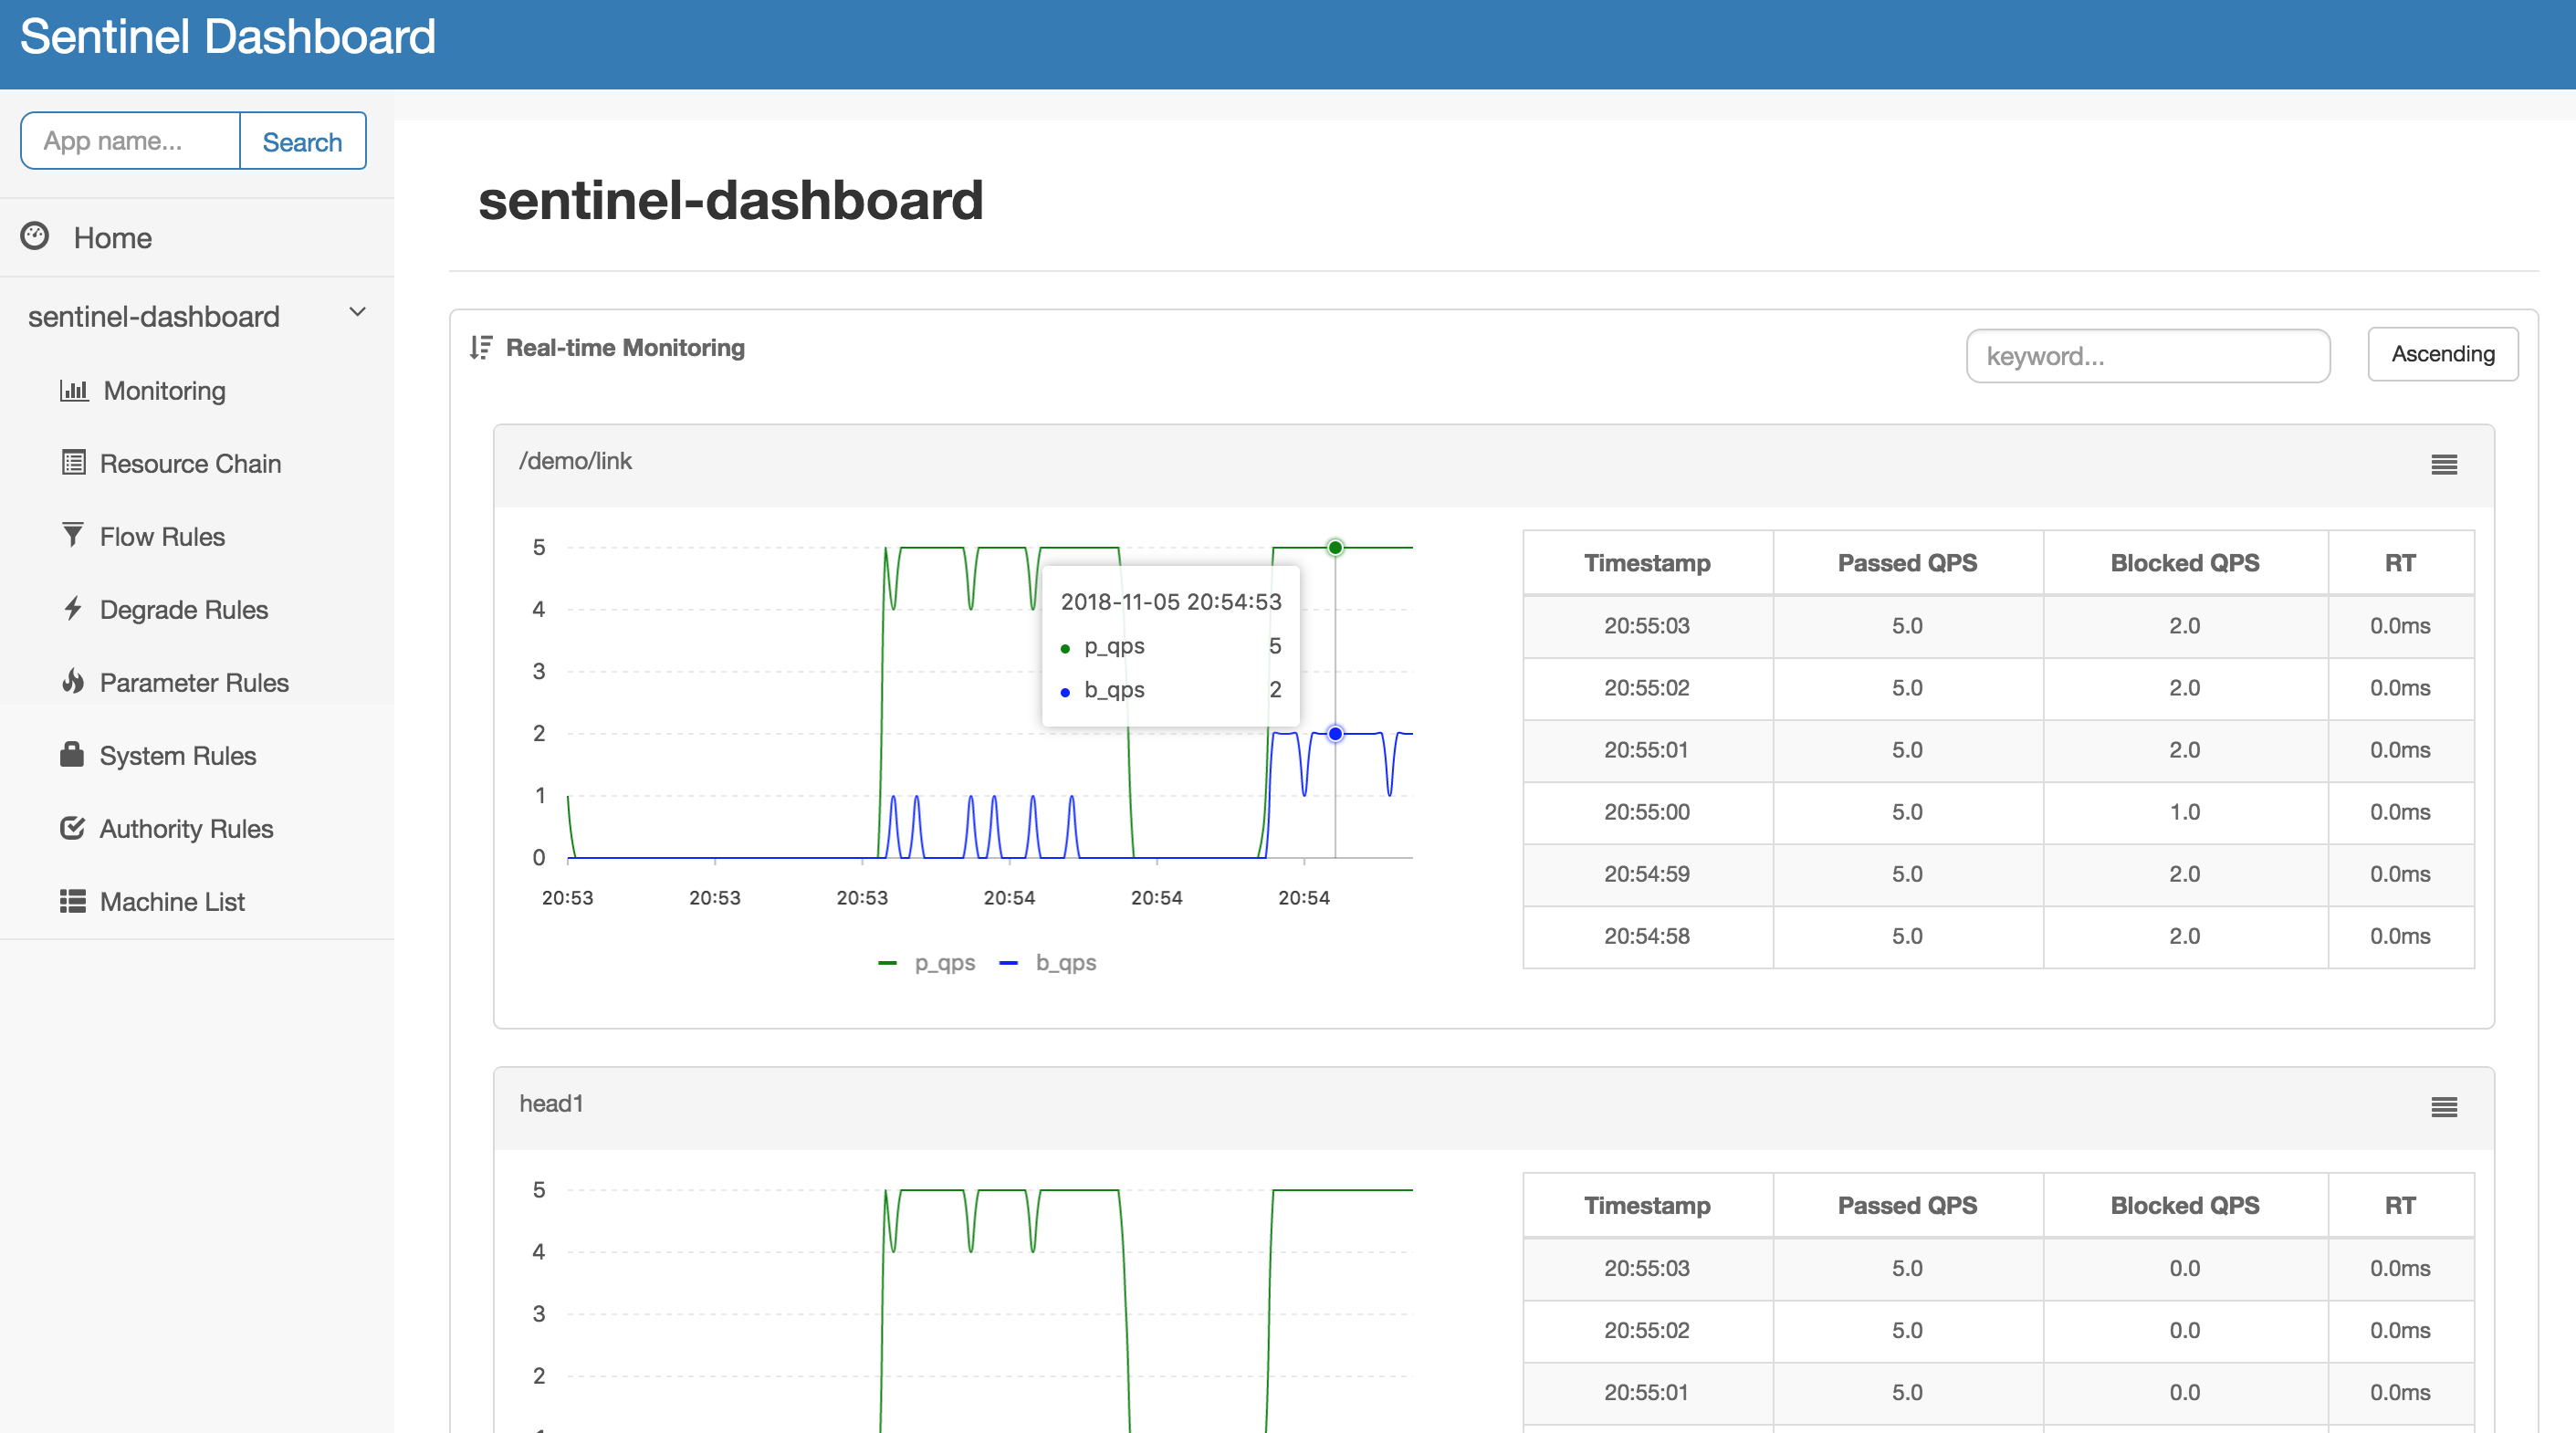
c. "Monitoring" will summarize resource metrics of all machines in the same application
Note: "Monitoring" will only record metrics in 5 minutes. If you need to persist these data, please refer to Metrics.
If any information is missed please check your configuration and troubleshoot via record.log and metricStat.log.pid<Pid No>.<Date>. For details please refer to logs.
5. Manage rules
Sentinel Dashboard provides rules management as well.
5.1 Rule queries
Rule page in Sentinel Dashboard:

You can also query rules on the dashboard via HTTP commands exposed by client site. For details please refer to HTTP API for rules.
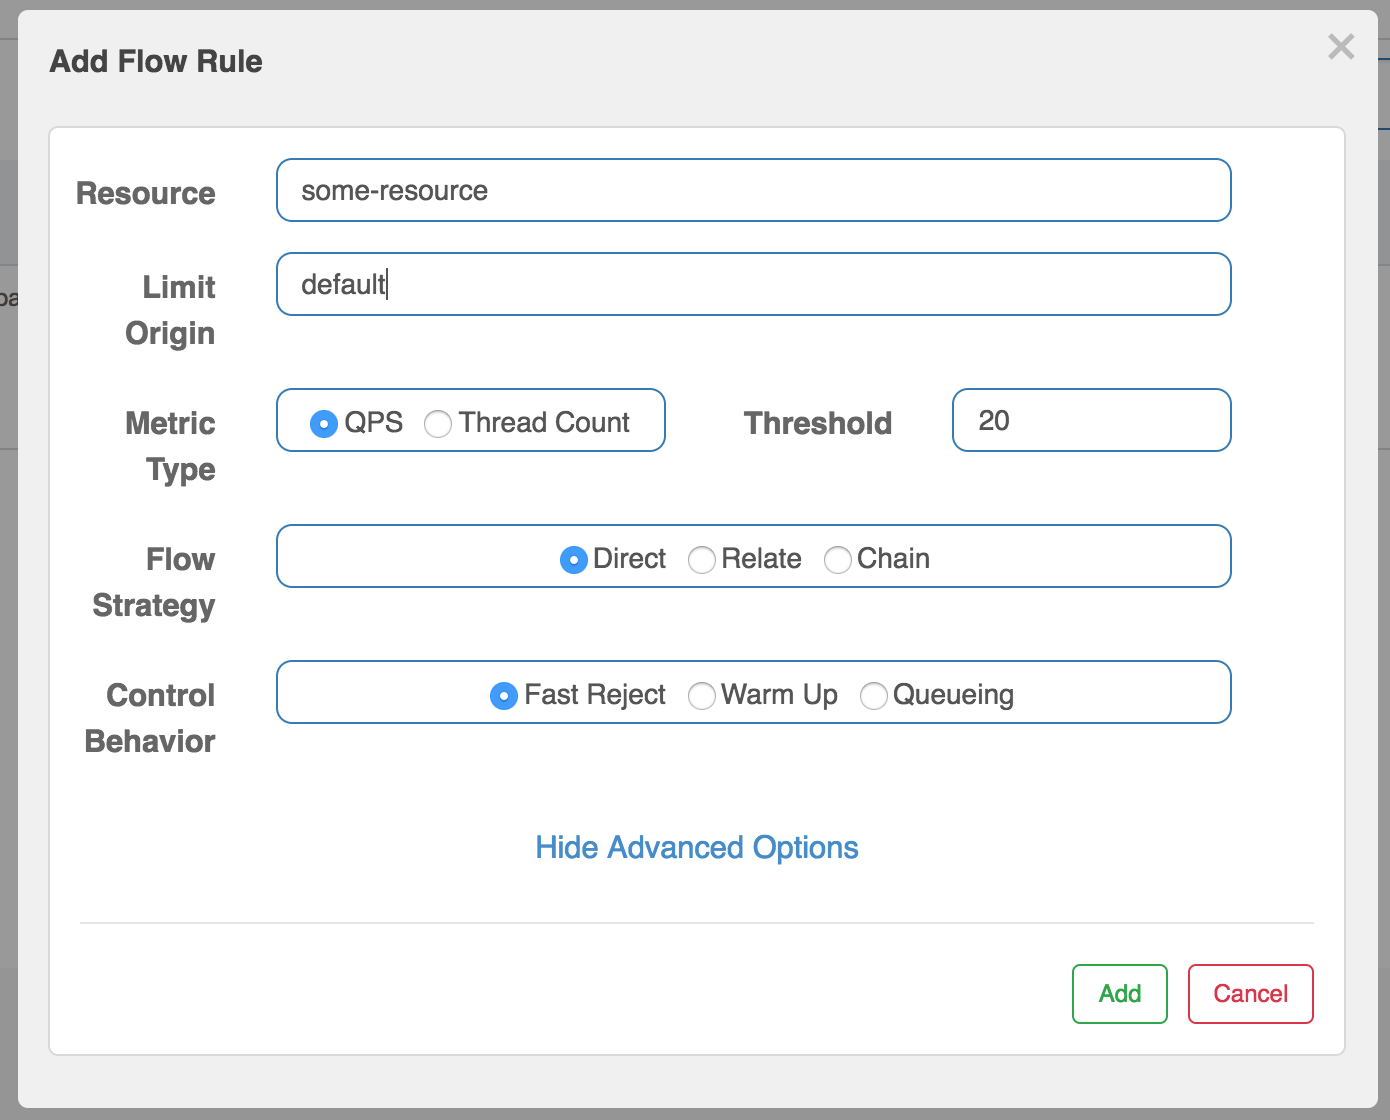
5.2 Rule configuration
You can add or edit rules in rule pages.
You can also modify rules on the dashboard in real-time via HTTP API for rules.
Note: All these rules are stored in memory by default.
We recommend you to use dynamic rule configuration to customize your own rule configuration logic.